Output View Guide
The Output View page in the Network Design tool provides a detailed overview of the results generated by the optimization process. This section will guide you through the various tables/sheets included in the output and explain the key columns within each sheet. Additionally, you'll learn how to export the output data into an Excel file for further analysis or reporting.
Output Sheets
The Output View is organized into three key sheets that summarize the results of the optimization process:
- Sites Found
- Customer-Site Assignment
- Scenario Summary
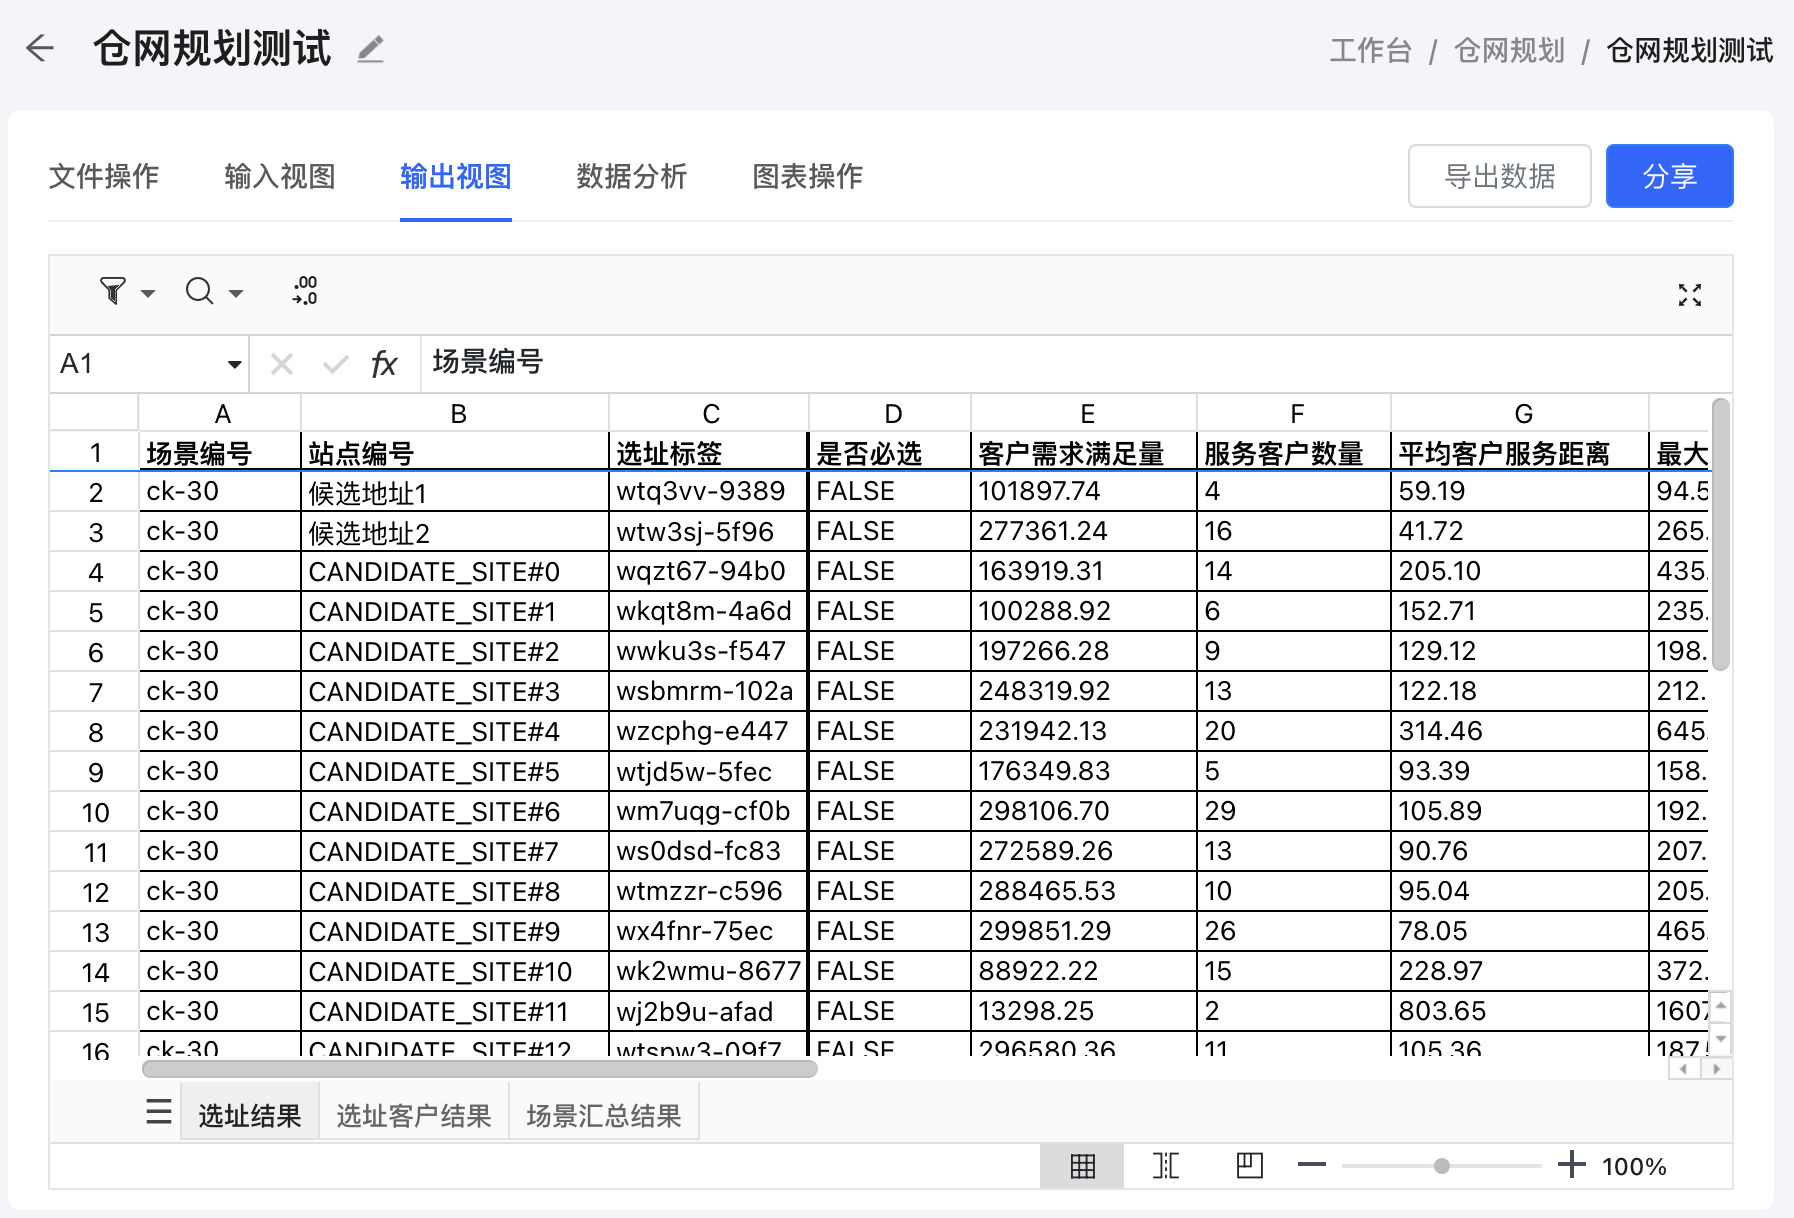
1. Sites Found
This table lists the sites identified by the optimization algorithm, including both new sites and existing ones. Each row represents a potential warehouse location.

- Scenario ID: The ID representing the scenario (e.g., 3 warehouses, 4 warehouses).
- Site Label: An auto-generated label or name used to identify the site in the results. This label is helpful for quick reference and reporting.
- Site ID: A unique identifier for each site.
- Mandatory: A checkbox column indicating whether the site is required to be included in the solution.
- Assigned Capacity: The total demand assigned to this site (sum of the demands of all customers assigned to this site).
- Assigned Customer Count: The total number of customers assigned to this site.
- Mean Distance: The average distance between this site and all customers assigned to this site.
- Max Distance: The maximum distance between this site and all customers assigned to this site.
- Latitude: The latitude of the site location.
- Longitude: The longitude of the site location.
- Site Cost: The total cost associated with this site, including setup and operational costs.
- Minimum Capacity: The minimum capacity required for this site as defined in the input data.
- Maximum Capacity: The maximum capacity allowed for this site as defined in the input data.
- Minimum Capacity Violation: The amount by which the assigned capacity falls below the minimum capacity. If there is no violation, this value will be 0.
- Maximum Capacity Violation: The amount by which the assigned capacity exceeds the maximum capacity. If there is no violation, this value will be 0.
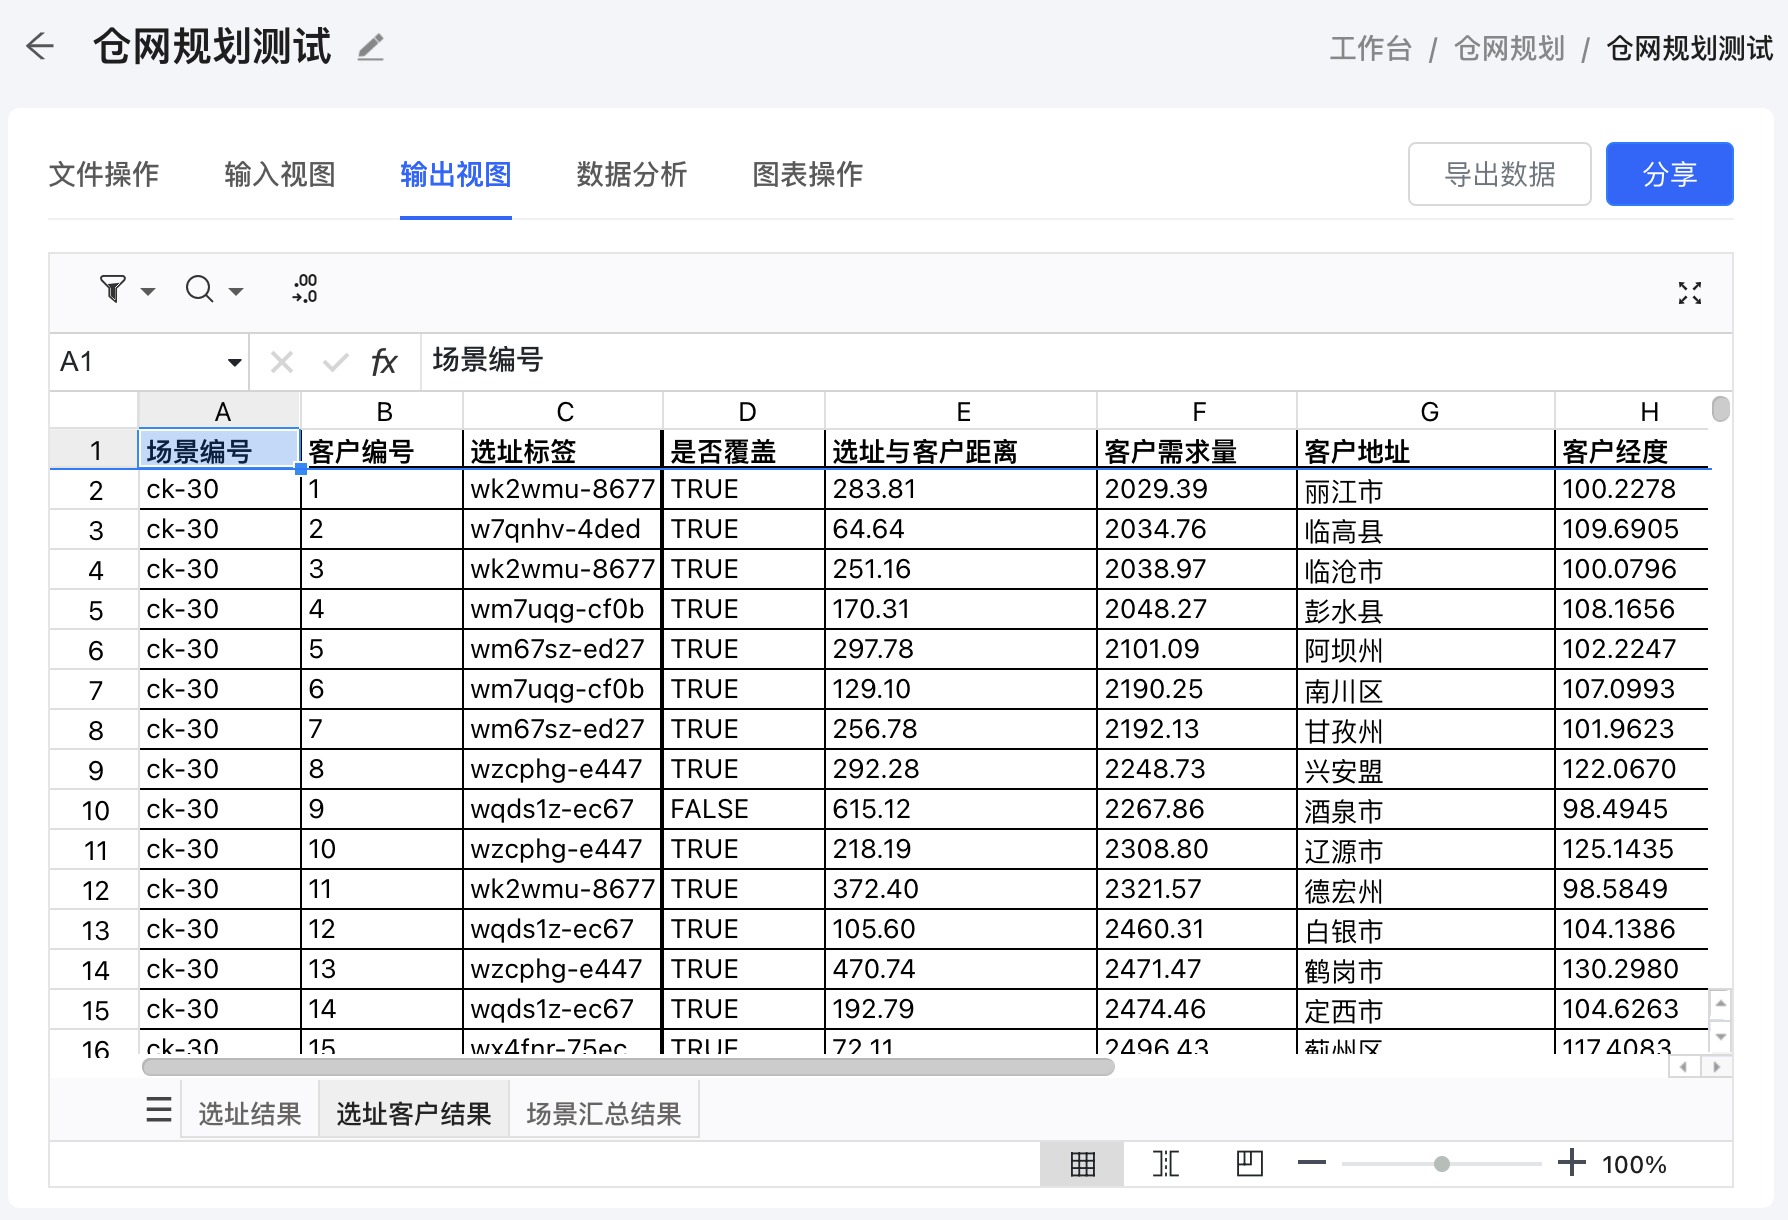
2. Customer-Site Assignment
This table details which customers are assigned to which sites, based on the optimization results.

- Scenario ID: The ID representing the scenario (e.g., 3 warehouses, 4 warehouses).
- Customer ID: The unique identifier for each customer.
- Within Service Distance: A checkbox indicating whether the customer is within the specified maximum service distance of the assigned site.
- Distance to Site: The distance (in kilometers or miles) between the customer and the assigned site.
- Customer Demand: The demand amount for the customer that is being served by the assigned site.
- Customer Address: The address of the customer, providing location details beyond latitude and longitude.
- Site Label: The label of the site to which this customer is assigned.
- Customer Latitude: The latitude of the customer's location.
- Customer Longitude: The longitude of the customer's location.
- Site Latitude: The latitude of the assigned site.
- Site Longitude: The longitude of the assigned site.
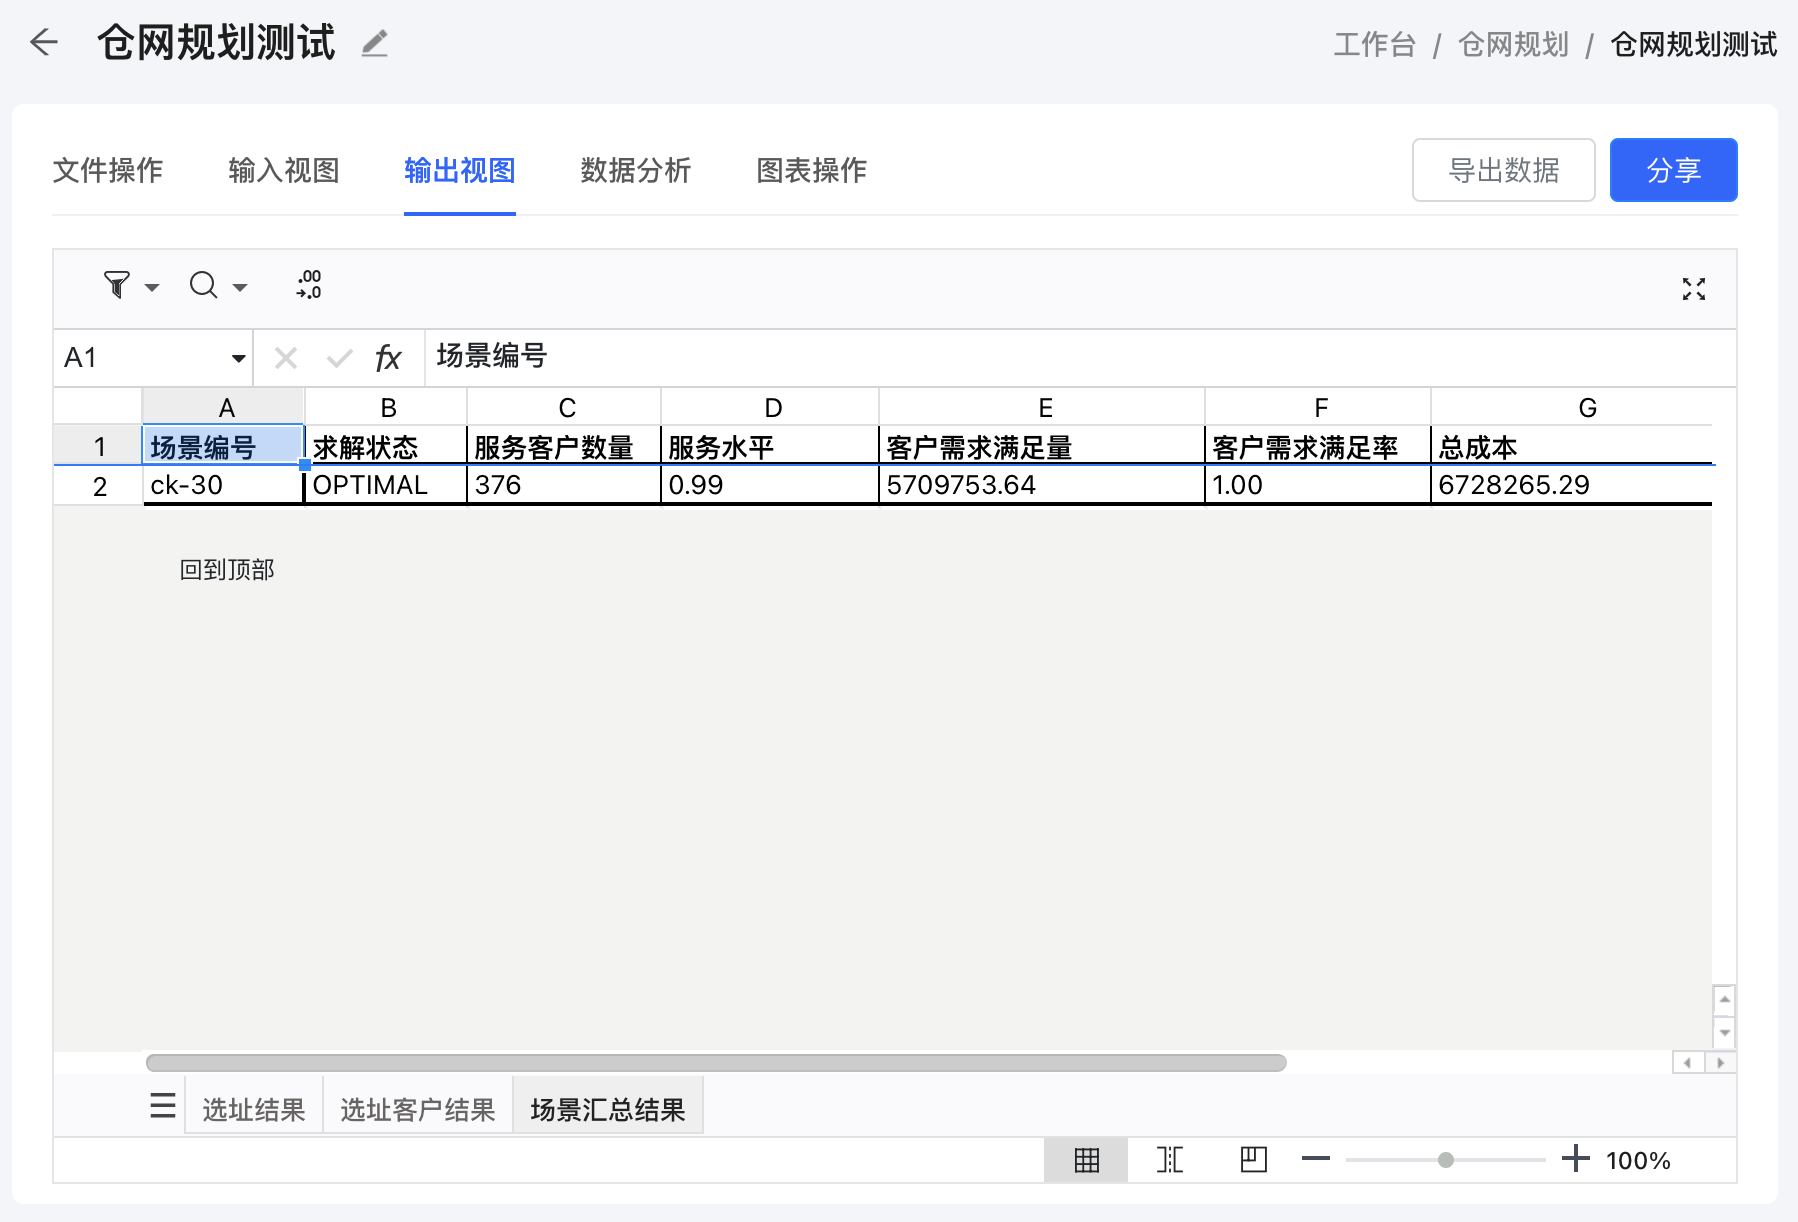
3. Scenario Summary
This table provides a high-level summary of key metrics for each scenario. Each row represents a different scenario with a specific number of warehouses.

- Scenario ID: The ID representing the scenario. It has a prefix "ck-" followed by a number. The number indicates the total number of sites included in the solution for that scenario.
- Solution Type: Indicates the type of solution for the scenario. Possible values:
- OPTIMAL: The solution is the best possible under the given constraints.
- FEASIBLE: The solution meets the necessary constraints, but may not be optimal.
- INFEASIBLE: The solution could not meet all constraints, and certain requirements were not fulfilled.
- Assigned Customer Count: The total number of customers assigned to the sites in this scenario.
- Service Level: The percentage of customers that are served within the specified maximum service distance.
- Assigned Capacity: The total capacity assigned to the sites in this scenario, summing up the demands of all customers assigned to the sites.
- Percentage of Total Demand Served: The percentage of the total customer demand that is served by the sites found in this scenario.
- Total Cost: The overall cost associated with the scenario, including warehouse setup, operational, and transportation costs.
- Total Distance: The total distance between the warehouses and the customers they serve, calculated as the sum of all customer-to-warehouse distances.
This table allows you to compare different scenarios and evaluate their effectiveness based on key performance indicators.
Exporting Output Data
On the Output View page, you'll find an Export Data button. Clicking this button will export all the output tables into an Excel file.
Tips for Using the Output View
- Analyze Scenario Comparisons: Use the Scenario Summary table to compare different scenarios and identify the one that best meets your operational goals.
- Review Customer Assignments: Ensure that customers are assigned to the most appropriate sites, considering both distance and demand.
- Export for Further Analysis: If you need to perform additional analysis or share results with your team, export the output data and work with it in Excel.