Warehouse Selection
Problem Statement
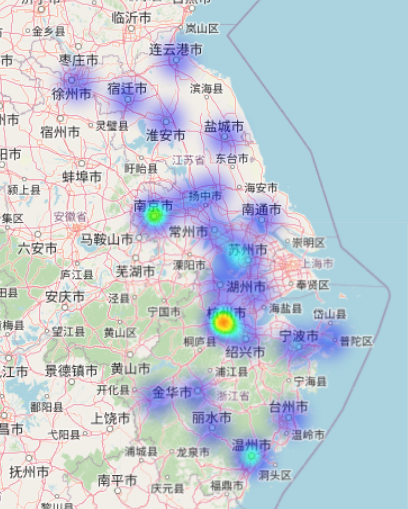
In this use case, we are tasked with solving a Warehouse Selection problem for a network of 100 stores spread across several metropolitan areas in Texas. From the demand heatmap, it is evident that demand is concentrated in specific regions:
- Fort Worth-Dallas area
- Houston
- Smaller clusters around San Antonio and Austin
The objective is to build only one warehouse to serve these stores. After an initial analysis, we have identified two potential candidate locations:
- One site near Dallas
- Another site near Houston
The central question is: Which warehouse location is better?
By comparing key factors such as service distances, transportation costs, and customer assignments for both locations, we aim to determine the optimal site that will best serve the stores in Texas while minimizing operational and logistical costs.
Preparing Data
For the warehouse selection problem, we will configure the input data based on the provided file. You can download the input data file here. Below are the key details for each data sheet:
1. Parameters Sheet:
To configure the model to select exactly one warehouse from the two candidate sites, set the following parameters:
- Minimum Number of Sites: Set to 1.
- Maximum Number of Sites: Set to 1.
- Minimum Candidate Sites: Set to 1.
- Maximum Candidate Sites: Set to 1.
These settings ensure that only one warehouse will be selected, and it must come from the candidate sites provided in the Sites sheet.
2. Customers Sheet:
This sheet contains the details of the 100 stores, including:
- Store ID
- Latitude and Longitude
- Customer Demand
Ensure that the store locations and demand data are accurately represented, as this will directly influence the optimization process.
3. Sites Sheet:
This sheet lists the two candidate locations for the new warehouse. Key fields include:
- Site ID: A unique identifier for each warehouse candidate.
- Latitude and Longitude: The geographical coordinates of the two candidate sites (one near Dallas and the other near Houston).
- Mandatory: Set to FALSE for both sites, allowing the optimization algorithm to decide which site is more suitable based on demand and other factors.
Once the data is set up, it will allow Convect AI's optimization tool to determine the most cost-effective location for the new warehouse.
Using the Network Design Tool
Follow these steps to use Convect AI’s network design tool to solve the warehouse selection problem:
-
Login to Convect AI's Flow Platform Navigate to https://flow.convect.ai and log in with your credentials.
-
Open the Network Design App Once logged in, open the Network Design app from the platform dashboard.
-
Create a New File Click the Create File button to initiate the process.
-
Upload the Input Data Enter the necessary details about the project and upload the prepared input file (which includes the Parameters, Customers, and Sites sheets). Wait until the data import process is completed.
-
Solve the Problem Once the data is imported, click the Solve button to start the optimization. The tool will process the data and calculate the optimal warehouse location based on demand and customer locations. Wait for the process to complete.
-
View the Results
- Navigate to the Output View tab to see the results in a spreadsheet format, including details on the selected warehouse and customer assignments.
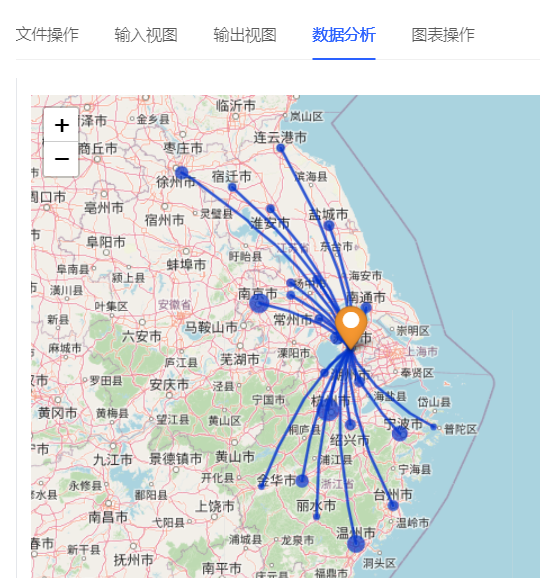
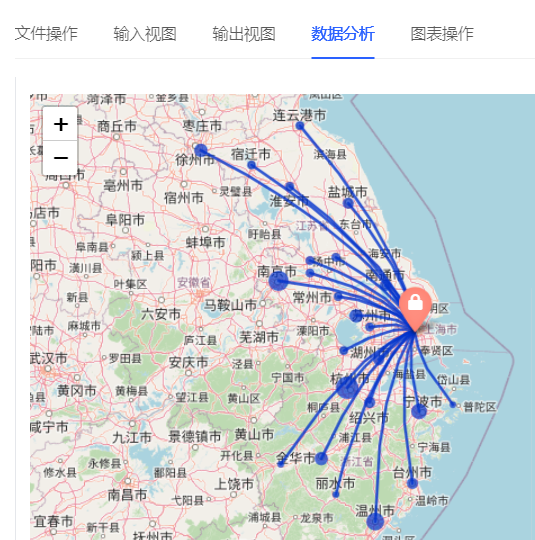
- For a visual representation, click the Graph View tab to see a map displaying the selected warehouse and the corresponding customer assignments.
Establishing an Alternative Scenario
To compare how much better the Dallas location is compared to the Houston location, we will create an alternative scenario by forcing the algorithm to select the Houston warehouse. Follow these steps:
-
Go to the Workbench Page Open the Network Design app, then navigate to the Workbench page, where you can view previous runs.
-
Duplicate the Previous File Select the file created in the previous step (where the Dallas location was chosen). Click the three-dot icon next to the Create File button and select Duplicate from the dropdown menu. Wait for the data copy process to finish.
-
Open the Duplicated File Click the link for the newly created duplicated file. This will open the input data in the Input View.
-
Modify the Sites Sheet In the Input View, navigate to the Sites sheet. Change the value of Mandatory to TRUE for the Houston location. This forces the algorithm to select the Houston site for this run. Click the Update Value button to save the change.
-
Solve the Alternative Scenario Click the Solve button to start the optimization process with the Houston location. The tool will recalculate the warehouse selection based on the change. Once the process is complete, you can view the results and compare them with the original scenario where the Dallas location was chosen.
Comparing the Solutions
To compare the results of the Dallas and Houston scenarios, follow these steps in Convect AI’s Flow Platform:
-
Open the Network Design App After logging into the platform, open the Network Design app.
-
Go to the Workbench Page In the Network Design app, navigate to the Workbench page where you can view previous runs.
-
Select the Files for Comparison Click on the two files corresponding to the Dallas and Houston scenarios to select them for comparison.
-
Open the Compare Option Click the three-dot icon to the right of the Create File button. This opens a dropdown menu where you can select Compare.
-
Configure Comparison In the popup box, select Output View as the view type and choose the Scenario Summary table. Click Confirm.
-
Compare the Results The page that follows will display the comparison of key metrics from both scenarios, side by side, enabling you to analyze the differences between the Dallas and Houston cases.
This comparison will allow you to see how much better the Dallas location is in terms of cost, service level, or any other relevant metrics.
Result Analysis
After running both the optimal and alternative scenarios, the results for the Dallas and Houston warehouse locations are compared. The following table summarizes the key metrics from both solutions:
| Solution Type | Selected Site | Total Distance (km) | Total Cost |
|---|---|---|---|
| Optimal | Dallas | 18,000 | $91M |
| Alternative | Houston | 25,000 | $128M |
Key Findings:
-
Distance Savings: Choosing the Dallas location reduced the total travel distance by 28% compared to the Houston location.
-
Cost Savings: The total cost for the Dallas warehouse is 29% lower than the Houston alternative.
Conclusion:
The results demonstrate that the Dallas location provides substantial savings in both travel distance and operational costs, with 28% less distance traveled and 29% lower costs compared to the Houston site. This analysis underscores the importance of selecting the optimal warehouse location.
Additionally, Convect AI’s network design tool allows for the selection of multiple candidate sites, giving businesses the flexibility to explore various options and determine the best configuration for their network.